Why Can't a "Parameter Comparison Sheet" Drive Procurement Decisions?
When most technical teams approach overseas proxy IP procurement, the first instinct is to open a spreadsheet and fill in each vendor's total IP count, pricing, and country coverage column by column. The sheet looks information-dense, but it cannot drive a decision.
The reason is direct: parameter alignment is not scenario fit. The same "residential proxy" product, used for cross-border product sourcing versus cross-border logistics tracking, has completely different requirements for response speed, geographic precision, and compliance boundaries. Parameter comparisons divorced from scenarios are like measuring fundamentally different things with the same ruler.
Industry surveys indicate that roughly 65% of first-time enterprise proxy IP procurement failures stem from "procurement criteria disconnected from actual business scenarios," rather than vendor product issues. In other words, the problem is not buying the wrong product — it's asking the wrong question.
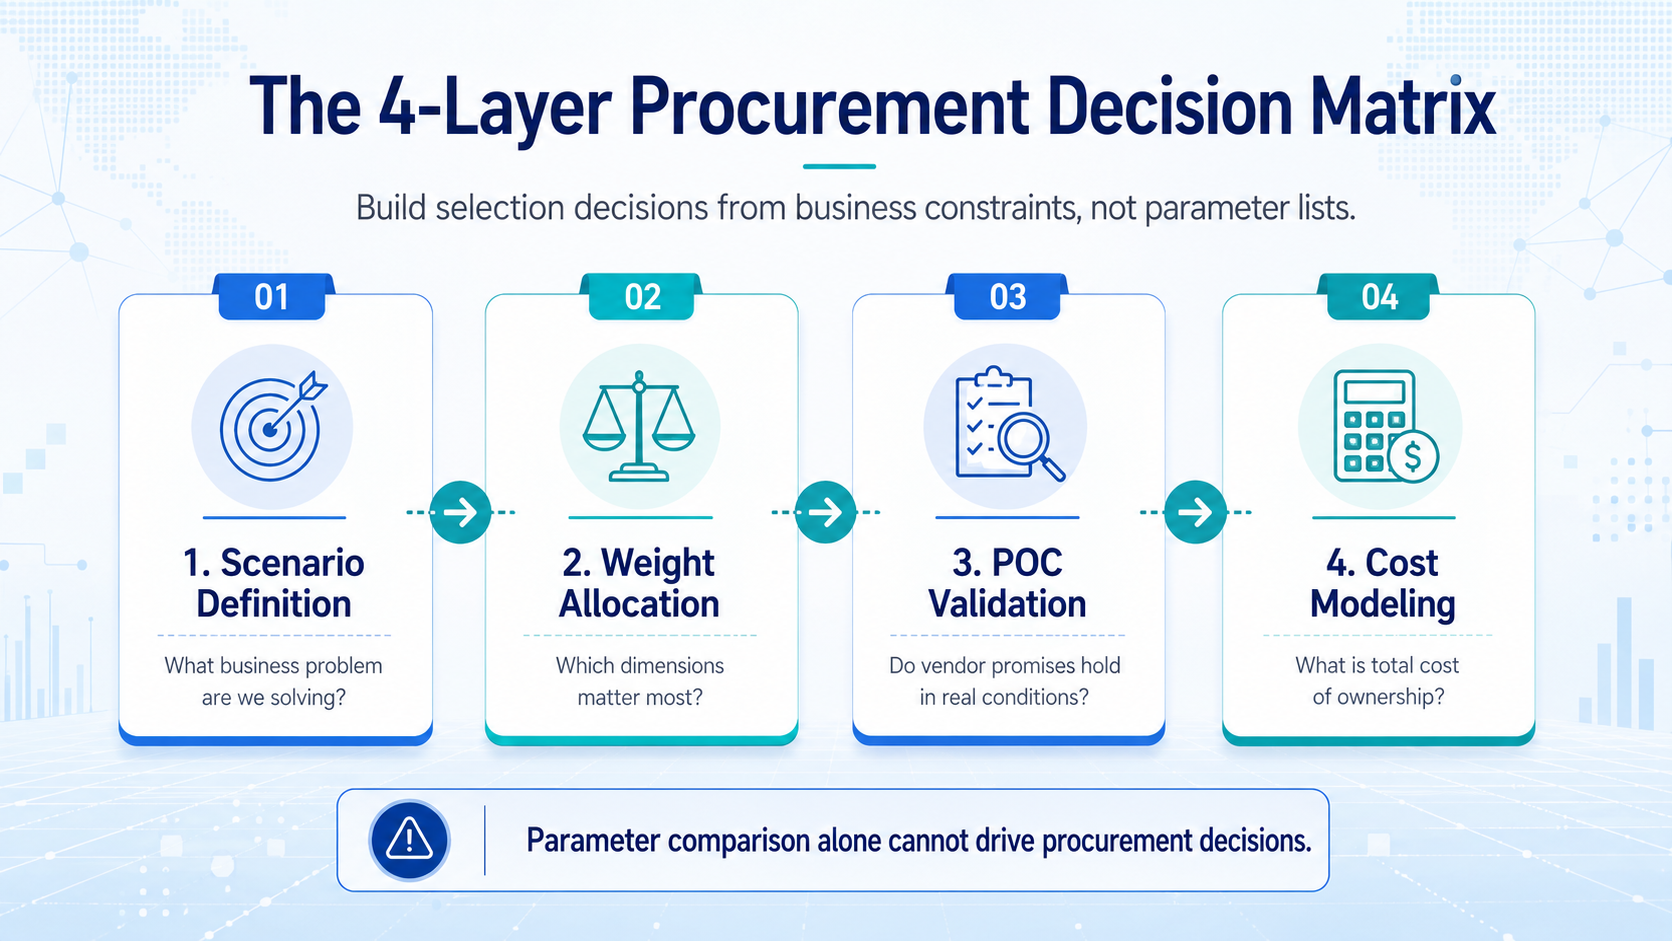
A workable procurement decision matrix needs four layers:
| Layer | Problem Solved | Deliverable |
|---|---|---|
| Layer 1: Scenario Definition | What business problem does this procurement solve? | Scenario card |
| Layer 2: Weight Allocation | Which dimensions matter most for this scenario? | Weighted scoring matrix |
| Layer 3: POC Validation | Do vendor commitments hold up in real conditions? | Validation report |
| Layer 4: Cost Modeling | What is total cost of ownership, not unit price? | TCO calculation sheet |
Parameters only appear in layers 3 and 4. If the first two layers are weak, no amount of data in the later layers will produce a sound decision.
What Goes Into a Scenario Card?
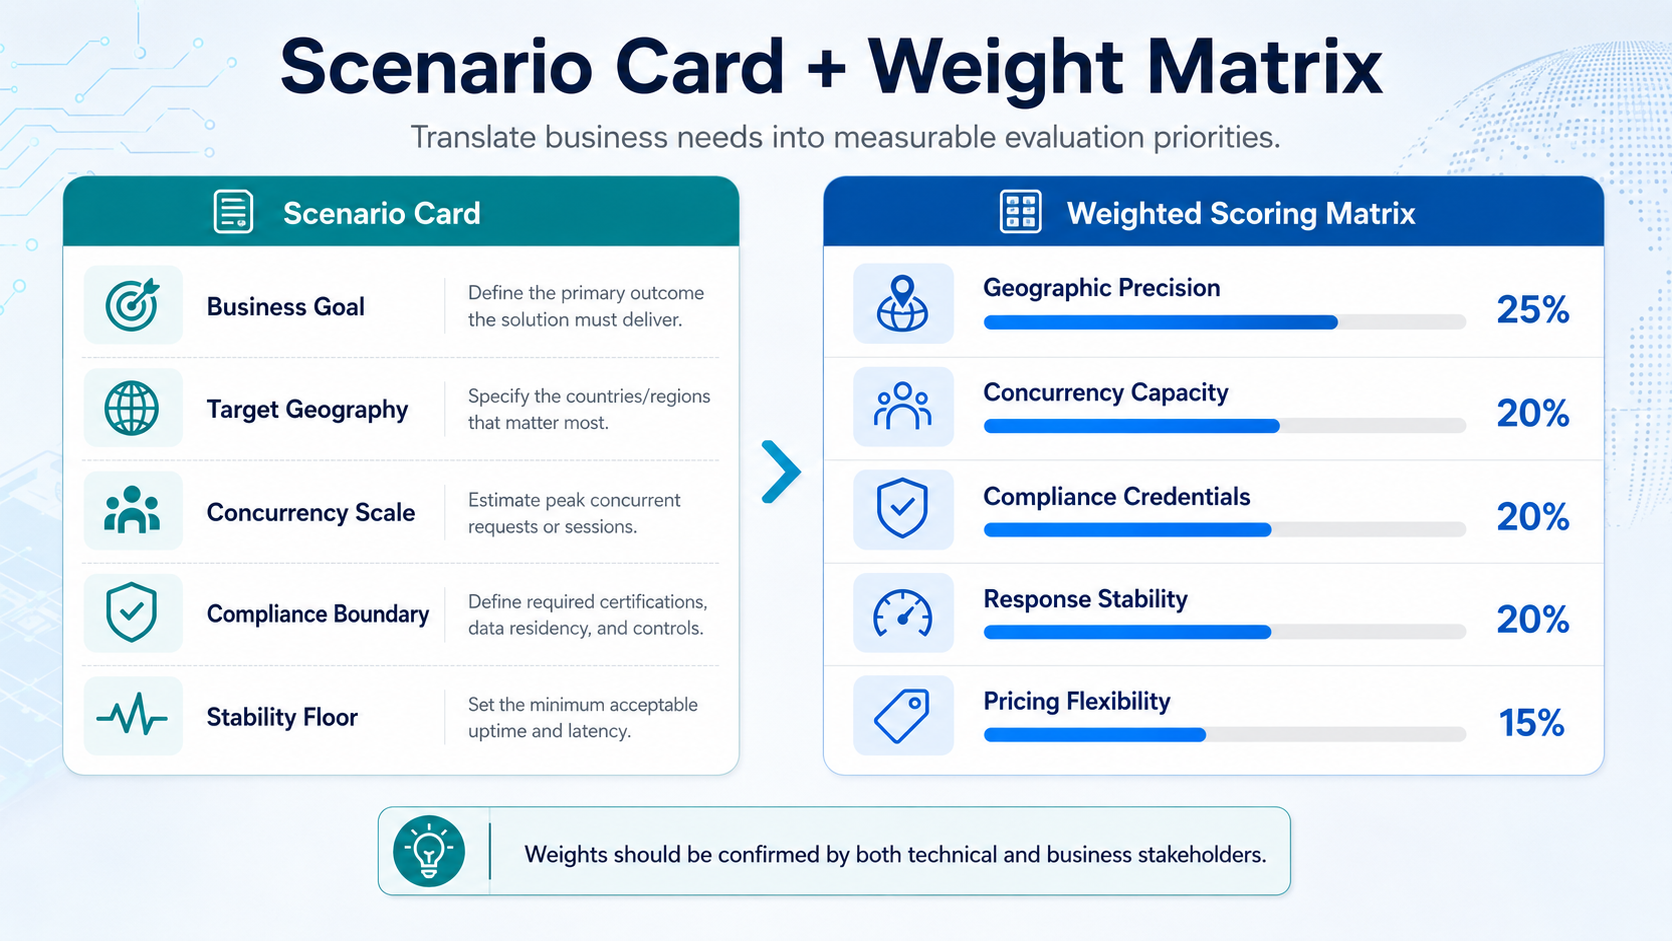
The scenario card is the anchor for the entire decision matrix and determines all trade-offs in the evaluation dimensions that follow. A workable scenario card answers five questions.
Scenario Card Template:
| Field | Description | Example A: Cross-border Sourcing | Example B: Cross-border Logistics Tracking |
|---|---|---|---|
| Business Goal | What task should this proxy IP batch complete? | Collect product pricing, inventory, and reviews from target market e-commerce platforms | Real-time queries for multi-country logistics rates, transit times, and customs policies |
| Target Geography | Which countries or regions need coverage? | 5 Southeast Asian countries + North America | 40+ countries' logistics nodes globally |
| Concurrency Scale | Daily request volume? Peak load? | 500K/day average, 2M/day peak during sales events | 200K/day steady, no major peaks |
| Compliance Boundary | Where are the legal limits of data collection? | Target platform's Terms of Service frequency limits, GDPR for EU user data | Logistics data is public commercial info, lower compliance risk |
| Stability Floor | Maximum tolerable failure rate and response delay? | Success rate ≥95%, response ≤5 seconds per request | Success rate ≥90%, delay relaxed to 8 seconds |
The core value of this card: it converts the vague "we need overseas proxy IPs" into measurable constraints. Subsequent weight allocation, vendor evaluation, and POC test design all derive from these five fields.
Two common mistakes to avoid. First, writing "global" for target geography. Actual business rarely needs 190+ country coverage; writing "global" introduces irrelevant coverage data into the evaluation. Second, leaving the stability floor blank. An evaluation without a floor is no evaluation at all — technical teams should derive proxy-layer tolerance from business SLAs.
What's the Trap in Weight Allocation?
With the scenario card in place, the next step is selecting evaluation dimensions and allocating weights. The most common error here is "every dimension matters" — producing an evenly weighted scoring sheet.
The result of even weighting: all vendors score between 60 and 70, the spread is too narrow to differentiate, and the decision matrix becomes ornamental.
Core Weight Allocation Principle: the five fields in the scenario card map directly to priority order in the evaluation dimensions.
Using the cross-border sourcing scenario:
| Evaluation Dimension | Weight | Rationale |
|---|---|---|
| Target Geographic Precision | 25% | Scenario requires 5 SEA countries + North America; precision is a hard threshold |
| Concurrency Capacity | 20% | 2M/day peak during sales directly impacts data freshness |
| Compliance Credentials & Data Acquisition Method | 20% | GDPR compliance is a legal red line, not a technical preference |
| Response Stability | 20% | 95% success floor maps to business SLA |
| Pricing Model Flexibility | 15% | Usage swings widely during sales; pay-as-you-go is more controllable than monthly plans |
For the same team, if the scenario shifts to cross-border logistics tracking, weights shift meaningfully:
| Evaluation Dimension | Weight | Rationale |
|---|---|---|
| Target Geographic Breadth | 30% | 40+ countries' logistics nodes — breadth matters more than precision |
| Long-cycle Stability | 25% | Logistics queries run continuously, requires 24/7 stable operation |
| Response Latency Tolerance | 15% | 8-second delay tolerance lowers this weight |
| Concurrency Capacity | 15% | 200K/day with no peaks, threshold is modest |
| Pricing Model Flexibility | 15% | Stable usage makes monthly vs. usage-based pricing roughly equivalent |
Key action: once weights are allocated, get sign-off from non-procurement business stakeholders. Industry experience shows that roughly 40% of procurement disputes stem from "technical-team-assigned weights misaligned with business priorities." Weight confirmation is a process gate, not a technical detail.
What Should a POC Actually Test?
POC validation is the layer most often compressed in a decision matrix. The common shortcut is "run the free trial for a day or two and check the success rate" — which is far from sufficient.
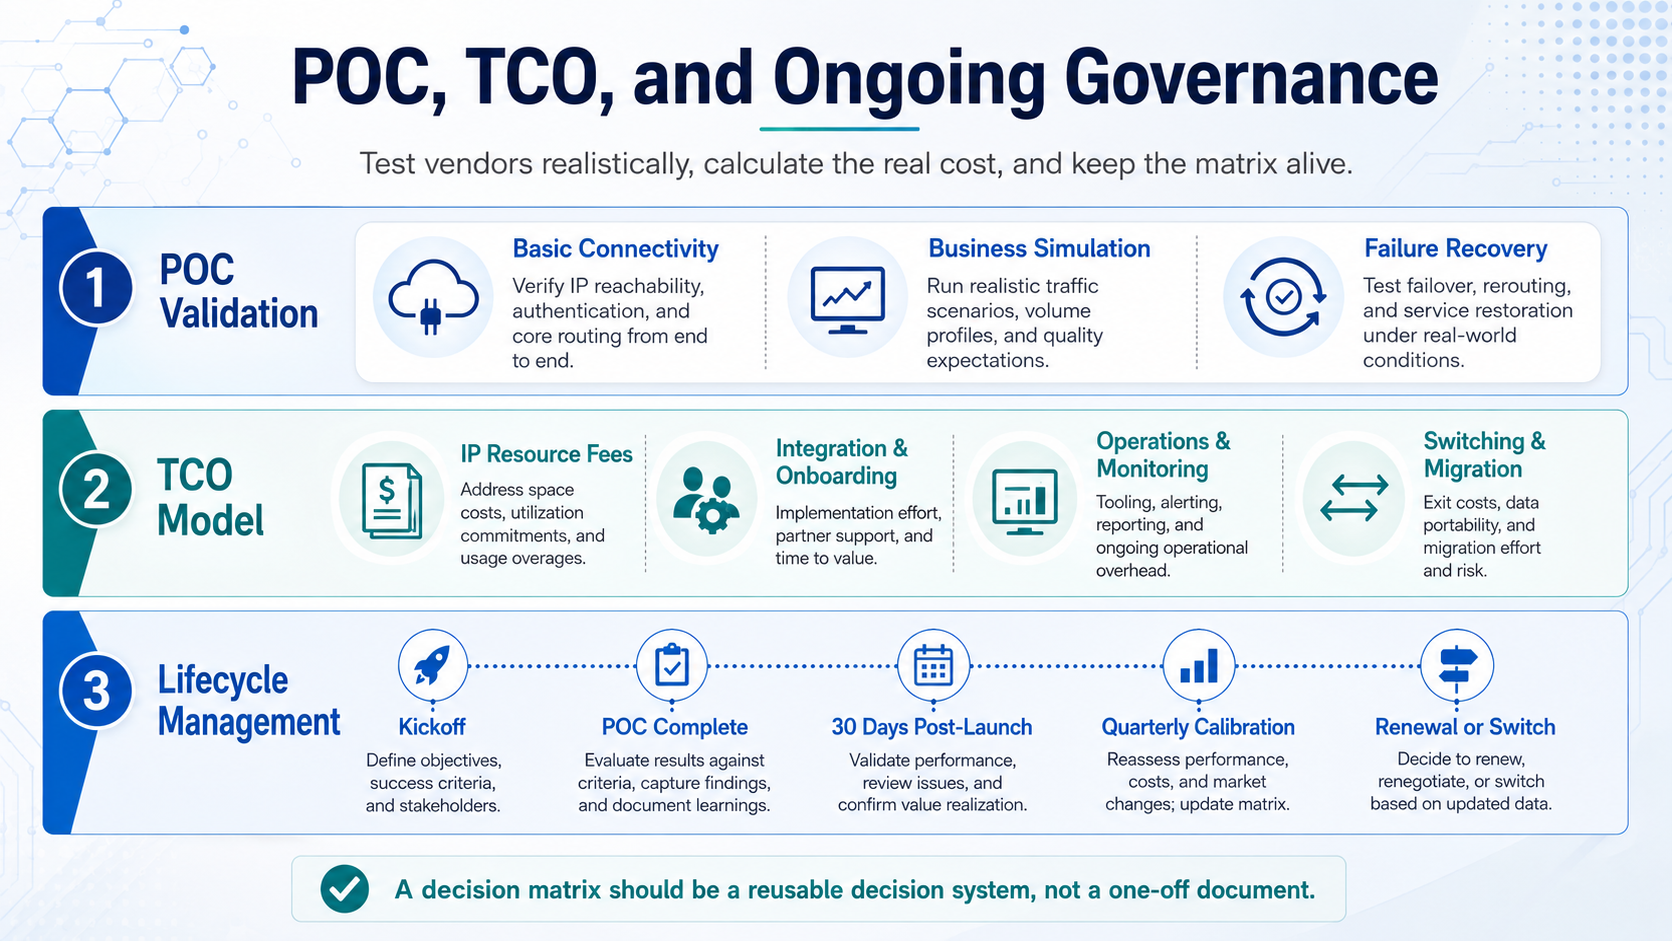
An effective POC covers three layers:
POC Testing Framework:
| Test Layer | Specific Items | Pass Criteria | Suggested Duration |
|---|---|---|---|
| Basic Connectivity | Target-geography IP availability, protocol compatibility, authentication integration | Target IPs work normally, authentication setup completes within 10 minutes | 1 day |
| Business Simulation | Run full-volume tests at real concurrency, request frequency, target sites | Success rate meets scenario card's floor | 3-5 days |
| Failure Recovery | Simulate IP throttling and observe switching speed, vendor response time, fallback effectiveness | Switching time within SLA, support response within agreed window | 1-2 days |
Three Often-Overlooked POC Points:
First, the test environment must closely mirror production. Running 10 concurrent requests on a test account versus 500 concurrent requests on a production account yields completely different results. Some vendors route trial accounts to a different IP pool than production accounts, so trial-period performance does not represent production use.
Second, log raw data, not just aggregated metrics. Looking only at "96% average success rate" can hide critical information like "success rate dropped to 70% at 3 AM." Hourly-granularity logs for success rate, response time, and IP switching frequency reveal hidden instability windows.
Third, test the vendor's service responsiveness. During the POC, proactively raise a support ticket and record response time and resolution quality. Industry data shows roughly 30% of enterprises encounter "support response slower than expected" as their first issue after going live — yet almost no one tests this dimension during the trial.
How Far Apart Are Total Cost of Ownership and Unit Price?
The most common procurement pitfall is "only looking at unit price." The real cost of overseas proxy IPs consists of four parts, with unit price typically accounting for 50%-65% of the total.
TCO Calculation Template:
| Cost Item | Calculation | Share | Why It's Overlooked |
|---|---|---|---|
| Direct IP Resource Fees | Unit price × volume | 50%-65% | Never overlooked, but often treated as the entire cost |
| Integration & Onboarding Cost | Engineer person-days × daily rate | 10%-15% | Vendors with incomplete docs can double engineer debugging time |
| Operations & Monitoring Cost | Monitoring setup + incident handling labor | 10%-20% | Unstable vendors significantly inflate this item |
| Switching & Migration Cost | Technical rework + business interruption losses | 5%-15% | Not considered at first procurement, but central at renewal |
Consider a cross-border sourcing team: 500K requests/day, running for 12 months.
| Comparison Item | Plan A: Low Price, Low Stability | Plan B: Mid Price, High Stability |
|---|---|---|
| Annual IP Resource Fee | Lower tier | Mid tier |
| Integration Onboarding | Incomplete docs, ~5 engineer-days | Complete docs and SDK, ~2 engineer-days |
| Annual Operations | 3 incidents/month requiring intervention, ~36/year | 0.5 incidents/month, ~6/year |
| Switching Cost | Forced switch within contract due to stability | No switch triggered |
| TCO Ranking | Higher total cost | More controllable total cost |
This calculation isn't complex, but most teams skip it on their first procurement. The result: choosing the lower-priced option, being forced to re-select half a year later due to operations and switching costs, and writing off the upfront investment.
Once the Decision Matrix Is Built, How Do You Keep It From Becoming a One-Off Document?
Most procurement decision matrices end up the same way: completed during selection, filed away, then rebuilt from scratch at the next renewal. That is waste.
A living decision matrix needs three mechanisms:
Mechanism 1: Quarterly Calibration. Every quarter, spend 15 minutes checking whether the five scenario-card fields have changed. Business expansion into new markets, growth in concurrency, or compliance updates all shift weight allocation. Without calibration, a decision matrix loses alignment with actual business within six months.
Mechanism 2: POC Data Archiving. Save each round of POC raw data in a standard format as a baseline for future evaluation. In industry practice, teams that retain historical POC data report renewal decision efficiency improving by roughly 40%, because they don't start testing from zero.
Mechanism 3: Decision Audit Trail. Tag every decision step on the matrix with the responsible person and supporting rationale. When procurement results go wrong, the audit trail quickly locates whether the issue was scenario definition, weight misallocation, or insufficient POC coverage — rather than devolving into "whose fault was it."
Decision Matrix Lifecycle Management Checklist:
| Milestone | Action | Owner | Deliverable |
|---|---|---|---|
| Procurement Kickoff | Fill in scenario card + weight matrix | Tech lead + business stakeholder | Decision matrix v1.0 |
| POC Complete | Record validation data, output evaluation | Tech lead | Decision matrix v1.1 + POC report |
| 30 Days Post-Launch | Compare POC data vs. production data, log deltas | Operations engineer | Variance log |
| Quarterly | Calibrate scenario card, update weights | Tech lead | Decision matrix vN.x |
| Renewal or Switch | Retrieve historical matrix + POC data as baseline | Procurement lead | New decision matrix |
What Does a Complete Decision Matrix Template Look Like?
Combining the four layers, the complete structure of an enterprise-grade overseas proxy IP procurement decision matrix looks like this:
Sheet 1: Scenario Card
| Field | Content |
|---|---|
| Business Goal | (fill in) |
| Target Geography | (specific countries/regions, not "global") |
| Concurrency Scale | (daily + peak) |
| Compliance Boundary | (applicable regulations and platform rules) |
| Stability Floor | (success rate + response delay cap) |
Sheet 2: Weighted Scoring Matrix
| Dimension | Weight | Vendor A Score | Vendor B Score | Vendor C Score |
|---|---|---|---|---|
| Dimension 1 | _% | /10 | /10 | /10 |
| Dimension 2 | _% | /10 | /10 | /10 |
| Dimension 3 | _% | /10 | /10 | /10 |
| Dimension 4 | _% | /10 | /10 | /10 |
| Dimension 5 | _% | /10 | /10 | /10 |
| Weighted Total | 100% | _ | _ | _ |
Scoring rule: each dimension is 0-10, multiplied by its weight, then summed. Dimensions derive from the five scenario-card fields rather than a fixed template.
Sheet 3: POC Validation Log
| Test Date | Test Layer | Vendor | Metric | Actual | Pass Criteria | Pass/Fail |
|---|---|---|---|---|---|---|
| Basic Connectivity | ||||||
| Business Simulation | ||||||
| Failure Recovery |
Sheet 4: TCO Calculation Sheet
| Cost Item | Vendor A | Vendor B | Vendor C |
|---|---|---|---|
| Annual IP Resource Fee | Price tier description | Price tier description | Price tier description |
| Integration Person-Days | _ days | _ days | _ days |
| Annual Operations Estimate | _/month | _/month | _/month |
| Switching Risk Rating | High/Med/Low | High/Med/Low | High/Med/Low |
| TCO Ranking |
Sheet 5: Decision Audit Trail
| Step | Conclusion | Decision Owner | Date | Rationale |
|---|---|---|---|---|
| Scenario Definition | ||||
| Weight Confirmation | ||||
| POC Pass | ||||
| Final Selection |
These five sheets form a linear chain: the scenario card determines the weight matrix, the weight matrix determines what the POC tests, POC data feeds the TCO calculation, and the final conclusion goes into the audit trail. Skip any layer and conclusions below lose their foundation.
A procurement decision matrix isn't a document that ends when selection ends — it's a continuously running decision system. The first build may take 2-3 weeks, but once operational, future renewal cycles compress to 3-5 days, because the scenario card, weight model, and historical POC data are all reusable assets.
FAQ
Q: Can companies without a technical team use this decision matrix?
The core of this template is a structured thinking flow, not a technical capability. Business stakeholders can complete the scenario card and weight allocation on their own. POC validation can be outsourced to vendors who provide test reports, but key metrics should be spot-checked rather than fully accepted from one source.
Q: Who should decide the weights in the matrix?
Weight allocation requires joint confirmation by the tech lead and business stakeholders. The technical side evaluates feasibility and test methods; the business side ranks priorities. Letting technical staff set weights alone often produces "perfect technical scores but unhappy business stakeholders."
Q: How long does POC testing need to be?
Basic connectivity 1 day, business simulation 3-5 days, failure recovery 1-2 days, totaling 5-8 days. POCs shorter than 3 days struggle to cover the business simulation layer, especially for scenarios with clear peak-valley patterns like cross-border sourcing — at minimum, one complete business cycle should be covered.
Q: Can multiple scenarios share a single decision matrix?
Not recommended. Weight allocations differ significantly across scenarios, and merging them dilutes scoring resolution. The correct approach: each scenario gets its own scenario card and weight matrix, but POC validation and TCO calculation can run in parallel during the same evaluation cycle to reduce duplicate work.
Q: How often should the procurement decision matrix be updated?
Quarterly calibration is the recommended cadence. Focus on whether the target geography, concurrency scale, and compliance boundary fields in the scenario card have changed. If the business expands into a new market or compliance policy shifts, trigger an immediate update rather than waiting for the next quarter.
Q: How do you tell whether POC data and production performance will diverge?
Two things matter. First, whether the POC account type matches the production account — some vendors allocate different IP pools to trial versus production accounts. Second, whether POC test concurrency approaches actual production volume. Thirty days after going live, compare the POC report against production monitoring data; deviations above 15% should trigger review.



