Why Is "Just Watching Uptime" Nowhere Near Enough?
Uptime is a result, not a cause. By the time uptime drops from 99% to 95%, the incident has usually been spreading for 5-10 minutes.
The monitoring pain point in enterprise data collection is that an IP pool is a dynamic resource—its health can't be captured in a single number. An IP pool at 99.5% uptime may be experiencing a concentrated failure at a specific city node, and that city may happen to be the core collection region for a sentiment monitoring task. In industry practice, about 65% of collection outages occur while uptime is still in the "normal range."
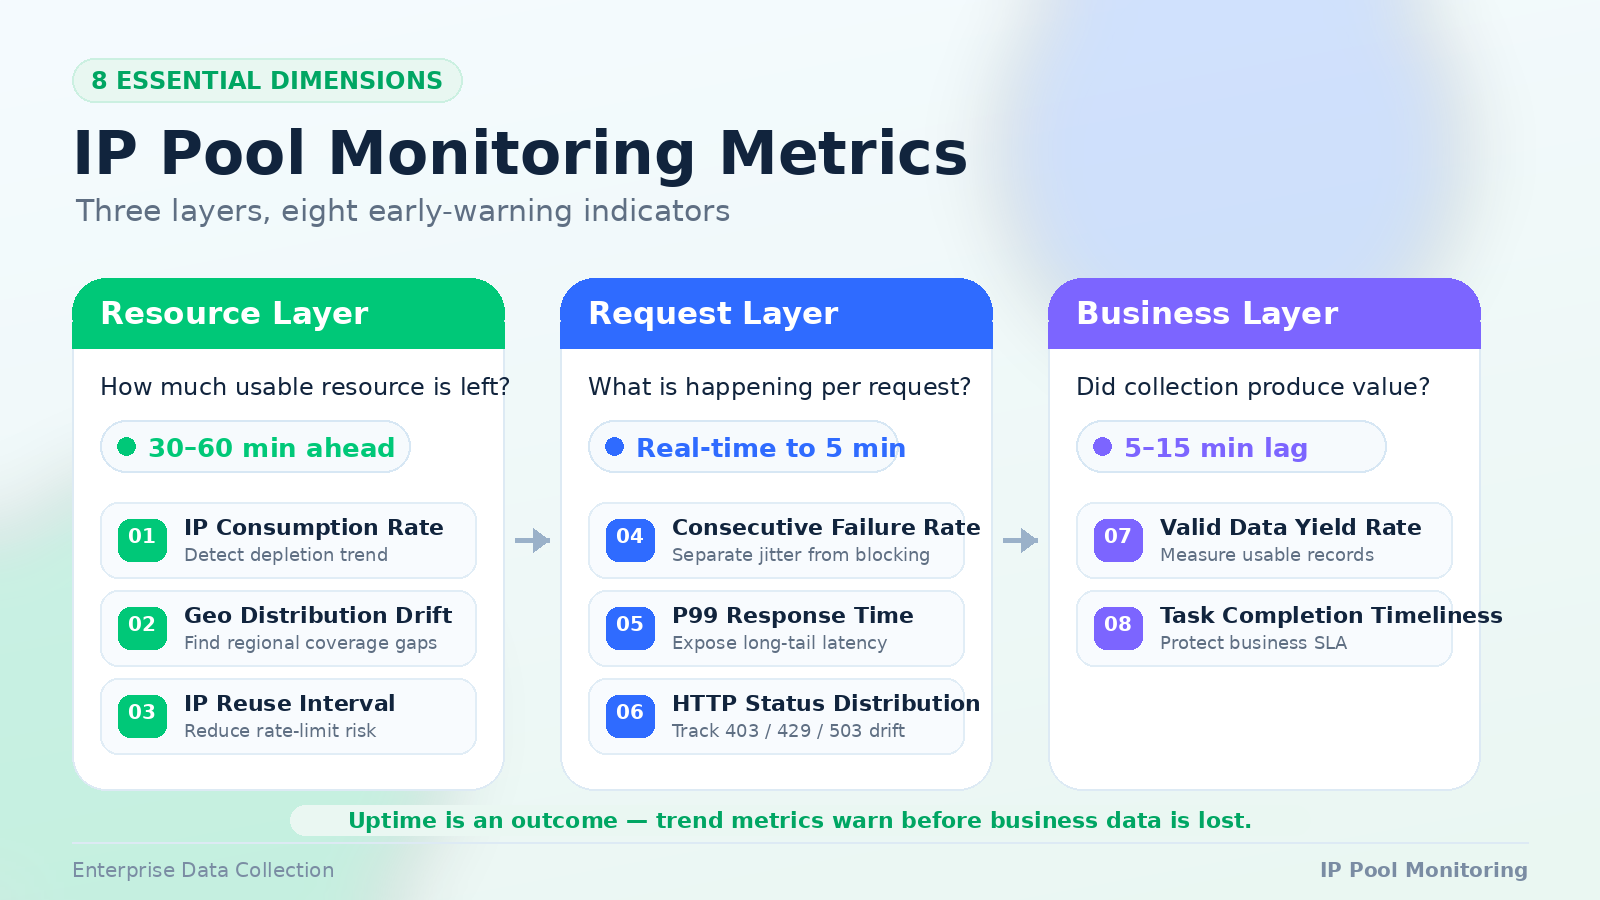
An effective monitoring system needs to be layered. Different layers answer different questions:
| Layer | Question Answered | Detection Window |
|---|---|---|
| Resource | How much usable resource is left in the pool? | 30-60 min ahead |
| Request | How's the quality of each individual request? | Real-time to 5 min |
| Business | How's the final outcome of the collection task? | 5-15 min lag |
All three are essential. Watching only the request layer, you miss the resource-depletion trend; watching only the business layer, by the time you notice you've already lost significant data.
Which Metrics Should the Resource Layer Monitor?
Resource-layer monitoring is fundamentally about answering "how long can the IP pool hold up." Three metrics need to be built.
Metric 1: IP Consumption Rate
Definition: the proportion of the total pool marked unusable per unit time.
The value of this metric is trend-based warning. If the past hour's IP consumption rate was 0.5%/hr and it suddenly jumps to 2%/hr, even with uptime still above 98%, the pool will face resource depletion in 4-6 hours.
| Consumption Rate | Health Status | Recommended Action |
|---|---|---|
| < 0.5%/hr | Healthy | Routine monitoring |
| 0.5%-1.5%/hr | Watch | Check for target-site policy changes |
| 1.5%-3%/hr | Warning | Switch to backup pool or lower concurrency |
| > 3%/hr | Danger | Immediately pause non-core tasks, investigate root cause |
In ad monitoring scenarios, because target-site rate-limiting policies update frequently, IP consumption rate typically fluctuates 30%-50% more than in other scenarios. Set an independent threshold baseline when monitoring these workloads.
Metric 2: Geographic Distribution Drift
Definition: the deviation between the current distribution of usable IPs and the target distribution.
Many collection tasks have explicit requirements for geographic IP distribution. Sentiment monitoring, for instance, needs to cover major provincial capitals nationwide. If usable IPs drop sharply in one region, even if the total remains unchanged, coverage for that region fails.
Calculation method: compare the cosine similarity between target and actual distributions—trigger alert below 0.85.
Metric 3: IP Reuse Interval
Definition: the minimum time between two consecutive uses of the same IP.
Industry practice data shows that when the IP reuse interval falls below 5 minutes, the probability of triggering target-site rate limiting rises above 40%. Enterprise-grade collection generally requires reuse intervals of at least 10 minutes; high-sensitivity scenarios require 30 minutes or more.
Which Real-Time Signals Should the Request Layer Watch?
The request layer is the metric layer closest to "the scene of the incident." Three core metrics need to be built.
Metric 4: Consecutive Failure Rate
Definition: within a sliding window, the proportion of N-in-a-row failed requests.
Consecutive failure rate has more diagnostic value than single-request failure rate. A single failure could be network jitter; 3+ consecutive failures are almost certainly IP blocking or a target-site policy change.
| Consecutive Failures | Common Cause | Response |
|---|---|---|
| 2 | Network jitter / occasional timeout | Auto-retry |
| 3-5 | IP blocked / target-site temporary policy | Drop the IP, switch pools |
| 5+ | Egress IP range blocked in bulk | Switch IP range, investigate bulk risk-control trigger |
In website scraper scenarios, a window of the last 50 requests is recommended. Full-volume monitoring at 100% sampling is workable below 500 QPS; above 500 QPS, switch to 10% sampling with statistical inference.
Metric 5: P99 Response Time
Definition: the 99th percentile of response time.
Using P99 rather than the average is because averages mask long-tail problems. In sentiment monitoring, if P99 spikes from 800ms to 3000ms, even with P50 still at 200ms, it means 5%-10% of requests are severely timed out—typically concentrated on specific IP ranges or regions.
Recommended thresholds:
| Scenario Type | Normal P99 Range | Alert Threshold |
|---|---|---|
| High-frequency short-text collection | < 500ms | > 1000ms |
| Full-page rendered collection | < 2000ms | > 5000ms |
| API endpoint collection | < 300ms | > 800ms |
Metric 6: HTTP Status Code Distribution
Definition: distribution shifts in request outcomes grouped by status code.
Don't just look at 4xx and 5xx totals—look at distribution changes. A spike in 403s usually means IPs are being blocked, a spike in 429s means request frequency triggered target-site throttling, and 503s may indicate the target site itself has failed.
A key technique: build a baseline distribution of status codes and detect drift using KL divergence. Alerting when KL divergence exceeds 0.3 adapts to different target sites' normal variance better than hard-coded thresholds.
Why Do Business-Layer Metrics Get Overlooked?
Business-layer metrics are the final verification—but also the layer most easily masked by "everything looks fine." Two core metrics need to be built.
Metric 7: Valid Data Yield Rate
Definition: the ratio of valid data records collected to total requests.
This metric separates "request succeeded" from "data was useful." The request layer may show 98% success, but if the target site returns empty pages, CAPTCHA pages, or stale cached data, the valid data yield rate might be just 60%.
Industry benchmarks:
- Structured data collection (API/JSON): valid data yield > 90%
- Semi-structured page collection (HTML parsing): > 75%
- Unstructured content collection (full text / images): > 60%
When yield drops more than 20% below these benchmarks, prioritize investigating IP quality over parsing logic.
Metric 8: Task Completion Timeliness
Definition: the proportion of collection tasks completed within their designated time window against total planned tasks.
This is the only metric that directly benchmarks against business SLAs. Ad monitoring typically requires hourly data updates—if task completion timeliness drops below 95%, it means blind spots have appeared in monitoring data.
Recommended bucket-by-priority monitoring:
| Task Priority | Timeliness Requirement | Timeout Tolerance |
|---|---|---|
| P0 - Core tasks | > 99% | None |
| P1 - Important tasks | > 95% | Tolerate 1 reschedule |
| P2 - Routine tasks | > 90% | Tolerate 2 reschedules |
How Are These 8 Metrics Related?
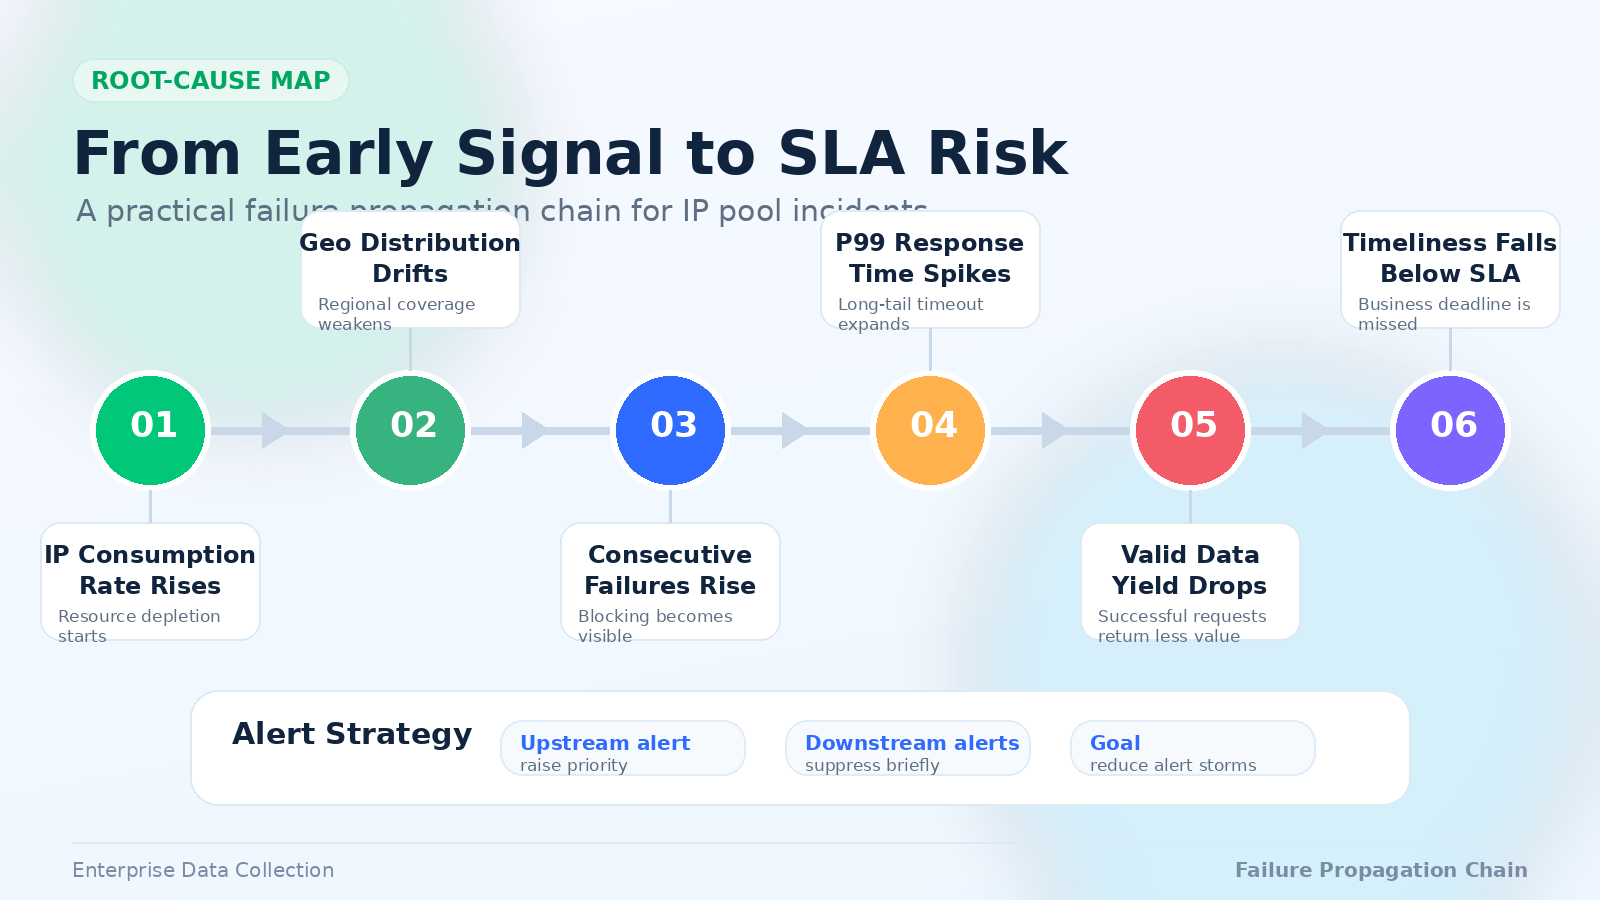
Metrics aren't isolated—there's a causal chain connecting them. Understanding this chain is what lets you jump from alert to root cause.
The typical failure propagation path:
IP consumption rate rises → geographic distribution drifts → consecutive failure rate rises → P99 response time spikes → valid data yield drops → task completion timeliness falls below SLA
When designing the monitoring system, set alert priorities along this chain in order. Once an upstream metric alerts, downstream thresholds can be relaxed slightly to avoid alert storms.
A practical set of correlated alert rules:
| Trigger Condition | Action | Suppression Rule |
|---|---|---|
| IP consumption rate > 2%/hr | Notify ops + auto-scale pool | Suppress downstream geographic-drift alerts for 30 min |
| Consecutive failure rate > 10% for 5 min | Notify ops + switch backup pool | Suppress downstream P99 alerts for 15 min |
| Valid data yield < 60% for 15 min | Notify business team + pause low-priority tasks | No suppression |
| Task completion timeliness < 95% | Escalate to tech lead | No suppression |
What Are the Practical Tips for Implementing the Monitoring System?
Defining metrics is only step one—there are several pitfalls when implementing.
Sampling frequency: 1-minute polling is enough for resource-layer metrics; request-layer metrics need real-time or 5-second granularity; business-layer metrics need 1-5 minutes. Excessive sampling frequency adds performance overhead and storage cost.
Alert grading and notification channels:
| Alert Level | Channel | Response SLA |
|---|---|---|
| P0 - Emergency | Phone + IM | 5 min |
| P1 - Important | IM | 15 min |
| P2 - Watch | Email / ticket | 2 hr |
| P3 - Info | Dashboard | Next routine check |
Dashboard design principles: keep it to no more than 12 charts per screen. Arrange left-to-right in "resource → request → business" order so troubleshooting naturally follows the causal chain. Encode key metrics with red-yellow-green so overall health can be read in 5 seconds.
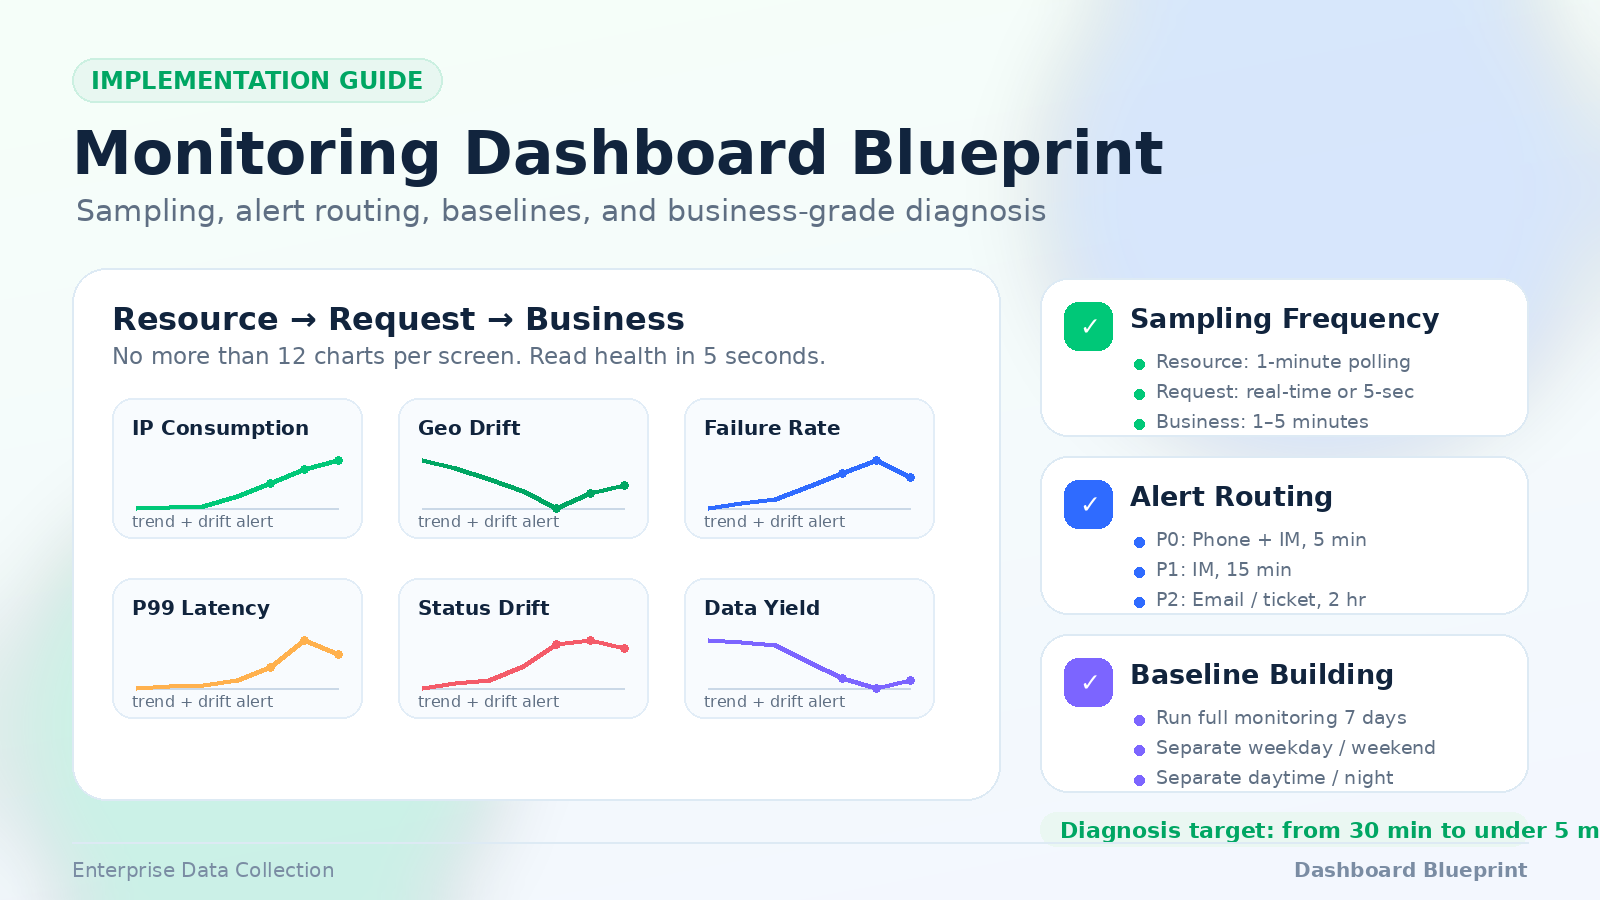
Baseline building: after onboarding a new IP pool, run full-volume monitoring for at least 7 days to establish a baseline. Baselines should distinguish weekdays from weekends and day from night. Metric fluctuations during major events in sentiment monitoring scenarios are normal and shouldn't trigger false alarms.
The value of a monitoring system isn't in the number of alerts—it's in the mean time from alert to root cause. A mature three-layer monitoring system can compress mean time to diagnosis from 30 minutes to under 5.
FAQ
Q: Isn't 8 metrics too many? Can a small team pare them down?
You can pare down to 4: IP consumption rate, consecutive failure rate, P99 response time, and valid data yield. These four cover at least one metric each from the resource, request, and business layers—the minimum viable monitoring set. Add the other four once team size and collection volume grow.
Q: What tools are best for collecting these metrics?
Prometheus + Grafana is currently the mainstream enterprise monitoring stack—mature community ecosystem and flexible alerting rules. If your team is already on ELK or Datadog, you can extend on top of the existing system. The key is that sampling frequency and retention meet your needs; the tool itself isn't the bottleneck.
Q: How do you technically implement IP reuse interval tracking?
Record each IP's last-used timestamp at the proxy scheduling layer. Query the timestamp before assigning an IP each time to calculate the interval. Use Redis ZADD sorted by timestamp for O(1) lookup complexity. Consider sharding once pool size exceeds 100,000 IPs.
Q: How do you tell whether an alert is a false alarm or a real incident?
Two evaluation dimensions: first, multi-metric correlation—if only a single metric is abnormal while correlated metrics are normal, it's very likely a false alarm or sampling noise; second, duration—real incidents typically persist for 5+ minutes, while over 90% of instantaneous spikes are network jitter. Set "sustained for N minutes" as an alert condition to filter noise.
Q: How should metric weights differ across collection scenarios?
For high-frequency short-cycle scenarios like ad monitoring, P99 response time and task completion timeliness carry the most weight. For long-cycle coverage-oriented scenarios like sentiment monitoring, geographic distribution drift and valid data yield matter more. Build independent monitoring profiles per scenario rather than sharing thresholds across all tasks.
Q: How long should monitoring data be retained?
Retain second/minute-level real-time metrics for 7 days, aggregated hourly data for 90 days, and daily rollups for 1 year. This strategy balances incident retrospection and capacity planning needs while keeping storage cost manageable.