Why Doesn't Passing a Test Mean It Will Work in Production?
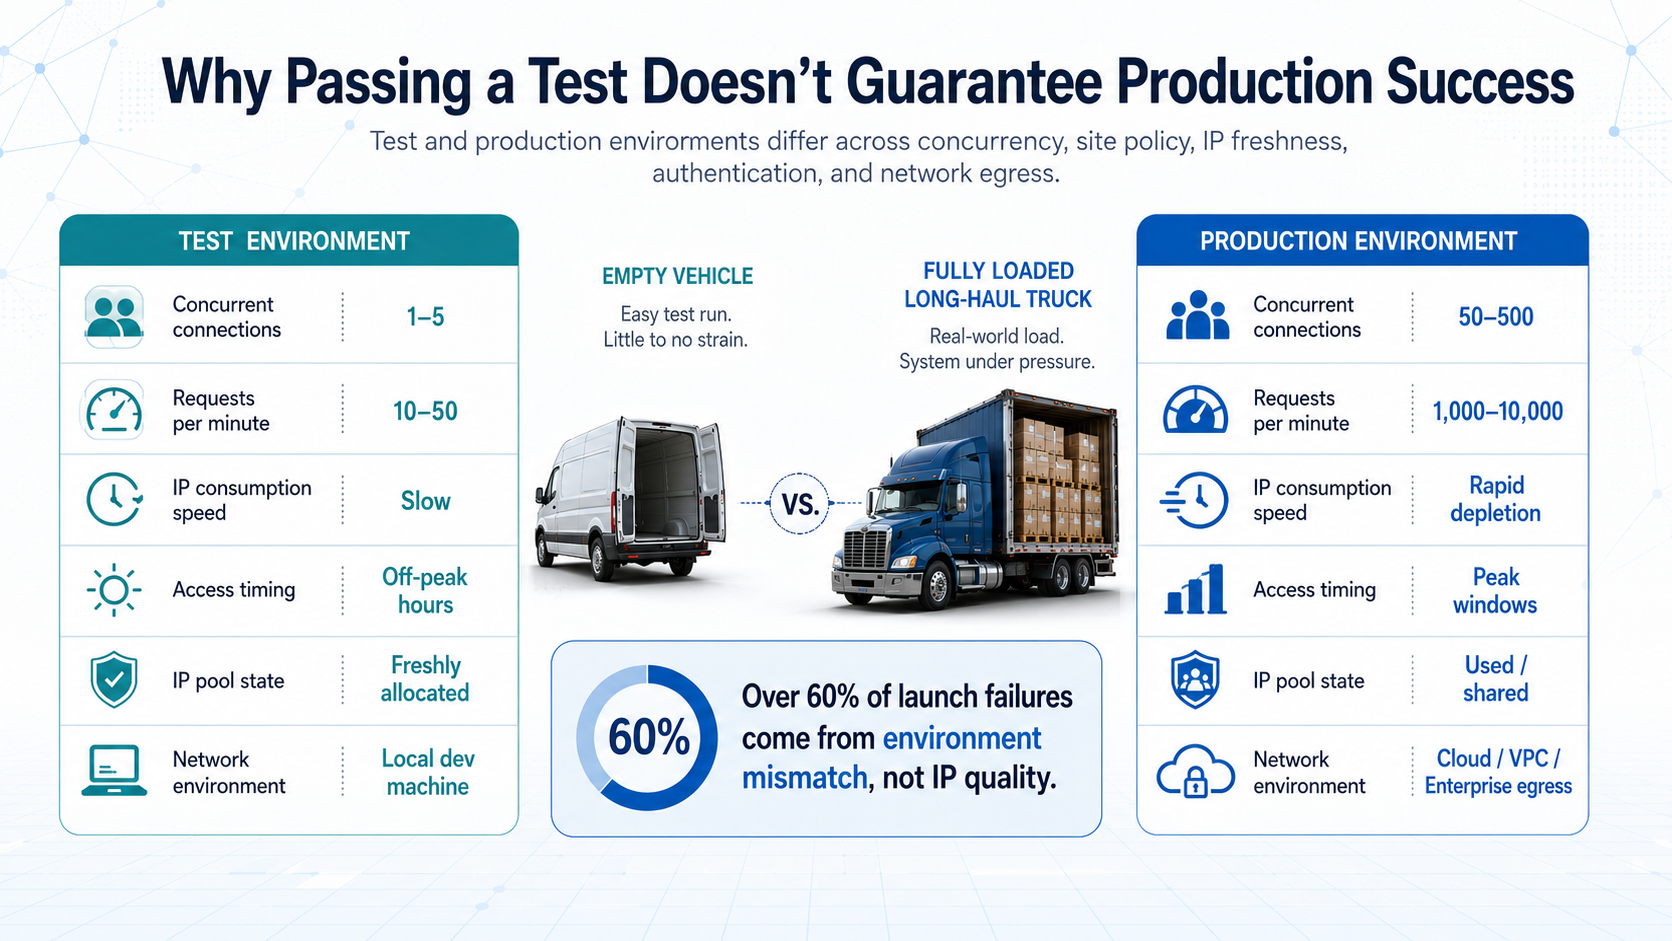
Test and production environments differ structurally — it's not just "more scale." Industry data shows that over 60% of residential IP launch failures aren't IP quality issues but configuration mismatches caused by environmental differences.
Testing phases typically share these characteristics: single-threaded or low-concurrency requests, the target site is accessed during off-peak hours, the IP pool is freshly allocated and in a high-freshness state, and the local dev machine connects directly to the proxy gateway. Almost none of these conditions hold in production.
Mapping test success rate directly to production expectations is like estimating a fully loaded long-haul truck's fuel cost from an empty test drive. Take social listening as an example: testing might only scrape the homepages of 3-5 target sites with no more than 10 requests per minute. After launch, you need to cover hundreds of information sources, with concurrency 50-100x higher — and the target site's rate-limiting strategy under high concurrency shifts from "indifferent" to "actively blocking."
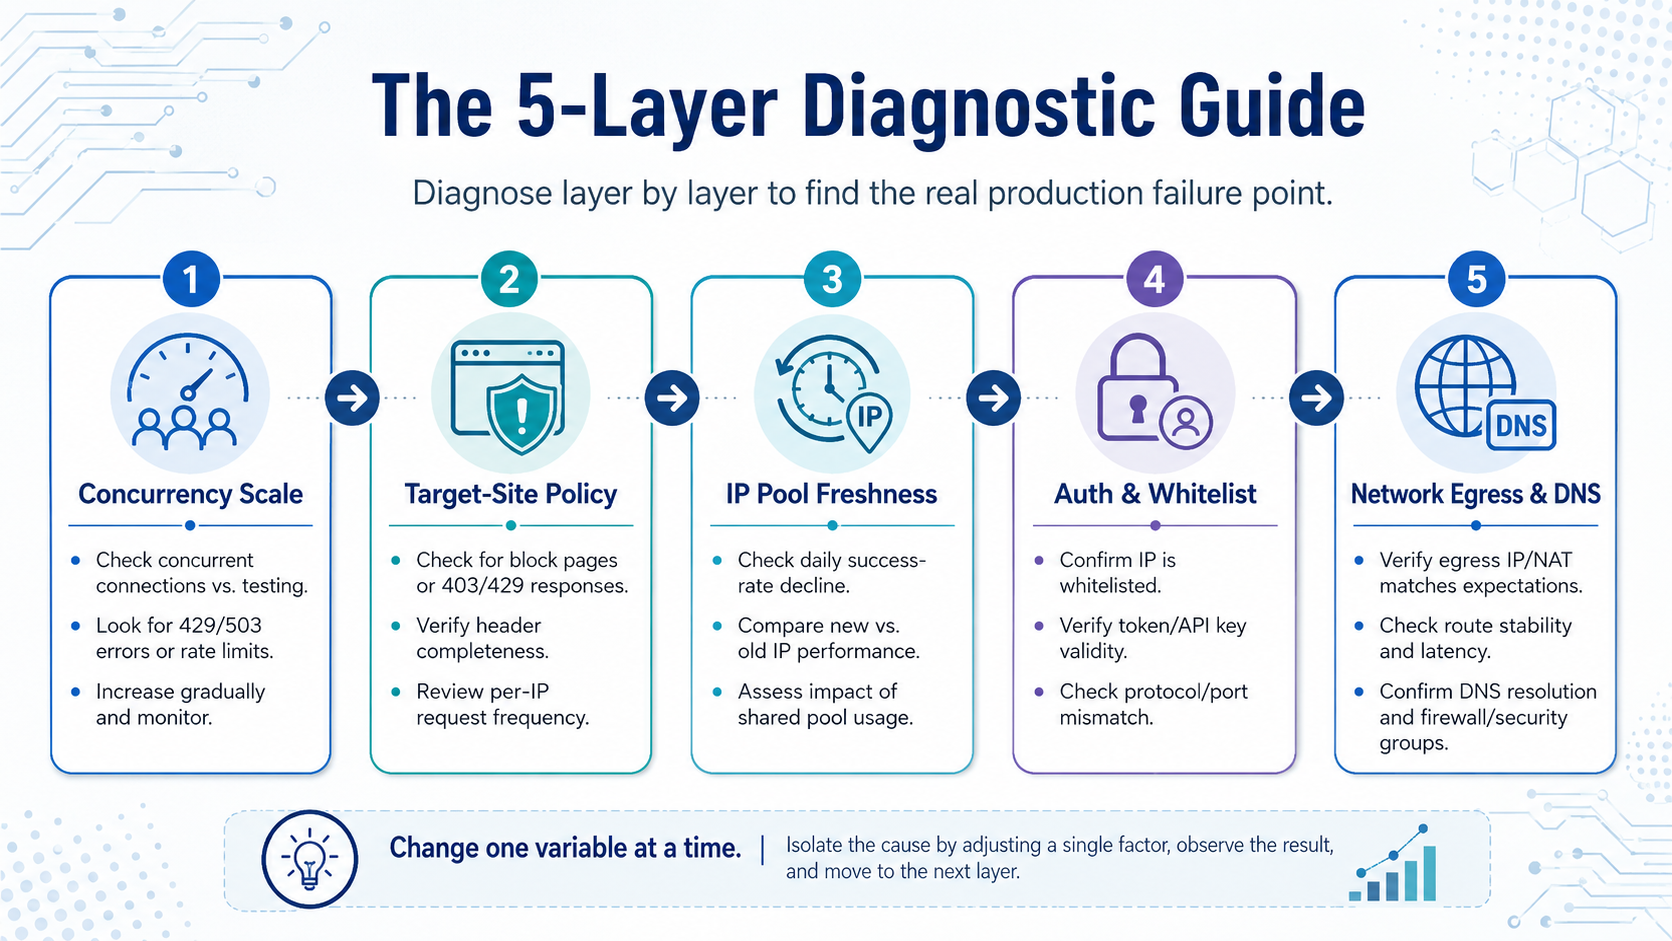
Layer 1: Is Concurrency Scale the Root Cause?
Concurrency scale differences are the most common failure cause, accounting for over 40% of launch failures.
| Comparison Dimension | Test Environment | Production Environment |
|---|---|---|
| Concurrent connections | 1-5 | 50-500 |
| Requests per minute | 10-50 | 1,000-10,000 |
| IP consumption speed | Extremely slow; almost no rotation | High-speed rotation; depletion in minutes |
| Proxy gateway load | Idle | Near or beyond concurrency cap |
Diagnostic steps:
- Compare actual concurrency between test and production to confirm whether the proxy service's concurrent connection cap has been exceeded
- Check the HTTP status code returned by the proxy gateway: 429 means request rate exceeded, 503 means gateway overload
- Gradual rollout testing: validate first with 10% of production traffic; once no anomalies appear, ramp up to 50%, then full volume
Key signal: If failures concentrate in peak traffic windows with 429 or 503 as the dominant error codes, concurrency scale is almost certainly the main cause. In ad monitoring, for example, monitoring multiple ad placement platforms simultaneously usually has peak concurrency stacking at morning and evening rush hours — failure rates in these windows are noticeably higher than other times.
Layer 2: Has the Target Site's Rate-Limiting Strategy Upgraded?
Target site policies aren't static. The same site responds differently across different time windows and access patterns.
Common triggers for strategy upgrades:
| Trigger Condition | Test-Phase Behavior | Production-Phase Behavior |
|---|---|---|
| Single-IP request frequency | Low-frequency access; doesn't trip thresholds | High-frequency access; triggers rate limiting |
| Access pattern recognition | Manual testing is random | Programmatic patterns are highly regular |
| IP reputation score | New IPs have high reputation | Reputation drops after high-frequency use |
| Browser fingerprint detection | Single fingerprint but low frequency | Same fingerprint appearing many times |
| Geographic concentration | Insensitive to single-region access | Many requests from one region trigger anomaly detection |
Diagnostic steps:
- Capture the failure response body in production — distinguish between proxy-layer failures and the target site returning a block page
- Compare the same target site's response under test vs. production IPs: manually request with
curlvia the proxy and observe whether it's normal - Check whether request headers are being simplified or omitted in production — especially User-Agent, Referer, and Cookie fields
- Lower the per-IP request frequency to the test level and observe whether the success rate recovers
For web scraper scenarios, some e-commerce platforms activate stricter rate-limiting policies during weekday daytime hours, while weekends and overnight are relatively relaxed. If testing was done on weekends and launch happened on a weekday, the policy difference alone can cause widespread failure.
Layer 3: Has IP Pool Freshness Decayed?
IP pools have a "freshness window." Residential IPs allocated during testing are usually fresh and underused. Once in production, the probability of an IP being flagged rises continuously over time and with multi-user sharing.
Typical signs of IP freshness decay:
- Day-one success rate is close to test levels, then declines daily
- Success rate briefly recovers after rotating the IP pool or requesting a new IP range, then drops again
- Failure rates for the same batch of IPs vary across target sites — meaning some sites have already flagged this IP range
Diagnostic steps:
- Track the daily success rate curve and watch for a declining trend
- Actively request IP rotation and compare success rates between new and old IPs
- Check whether the proxy provider's IP pool update frequency meets your business needs
- Confirm whether you're sharing an IP pool with other workloads — multi-business pool sharing accelerates IP flagging
Industry empirical data shows: in shared, non-isolated IP pools under high-frequency scraping, the average IP usable lifetime is around 72 hours; with business-isolated dedicated pools, the usable lifetime can extend to 7-14 days.
Layer 4: Are There Auth or Whitelist Differences Between Environments?
Authentication configuration is the most overlooked failure source. Test and production environments may have completely different network egress, server IPs, and auth credentials.
| Check Item | Common Issue | Verification Method |
|---|---|---|
| Whitelisted IP | Production server's egress IP not added to whitelist | Log into the proxy console and confirm the whitelist |
| API auth token | Test uses personal token; production needs enterprise token | Compare auth credentials between the two environments |
| Proxy protocol | Test uses HTTP; production needs HTTPS or SOCKS5 | Check the protocol prefix on the proxy connection string |
| Proxy port | Test uses default port; production firewall blocks it | Test port connectivity with telnet or nc |
| DNS resolution | Test uses local DNS; production uses internal DNS | Compare nslookup results |
Quick verification script approach:
On the production server, use a minimal script to replicate the test environment's request style. Don't use the scraping framework — just curl or the most basic HTTP library, single-threaded, single target site, low frequency. If this minimal test also fails, the problem is most likely at the auth or network layer. If the minimal test succeeds, the problem is in business logic or the concurrency layer.
Layer 5: Could Network Egress and DNS Differences Be Breaking the Link?
Production network topology is usually much more complex than a dev machine.
Network-layer differences to investigate:
- Whether the production server sits behind an enterprise firewall or security gateway — some devices intercept proxy protocol traffic
- Whether the production server's egress IP is a stable public IP — under NAT, the egress IP may change and break the whitelist
- Whether production DNS resolution matches test — internal DNS may be unable to resolve the proxy gateway domain
- In containerized deployments, whether the proxy is correctly configured in the container's network stack — overlay networks may not support the SOCKS protocol
- Whether cloud server security group rules allow outbound traffic on the proxy port
Quick-reference diagnostic commands:
| Purpose | Command |
|---|---|
| Test proxy port connectivity | nc -zv proxy-host port |
| Confirm egress IP | curl -x proxy:port ifconfig.me |
| Check DNS resolution | nslookup proxy-gateway-domain |
| Verify the proxy chain | curl -v -x http://user:pass@proxy:port https://httpbin.org/ip |
| Check firewall rules | iptables -L -n or cloud console security groups |
In What Order Should You Diagnose?
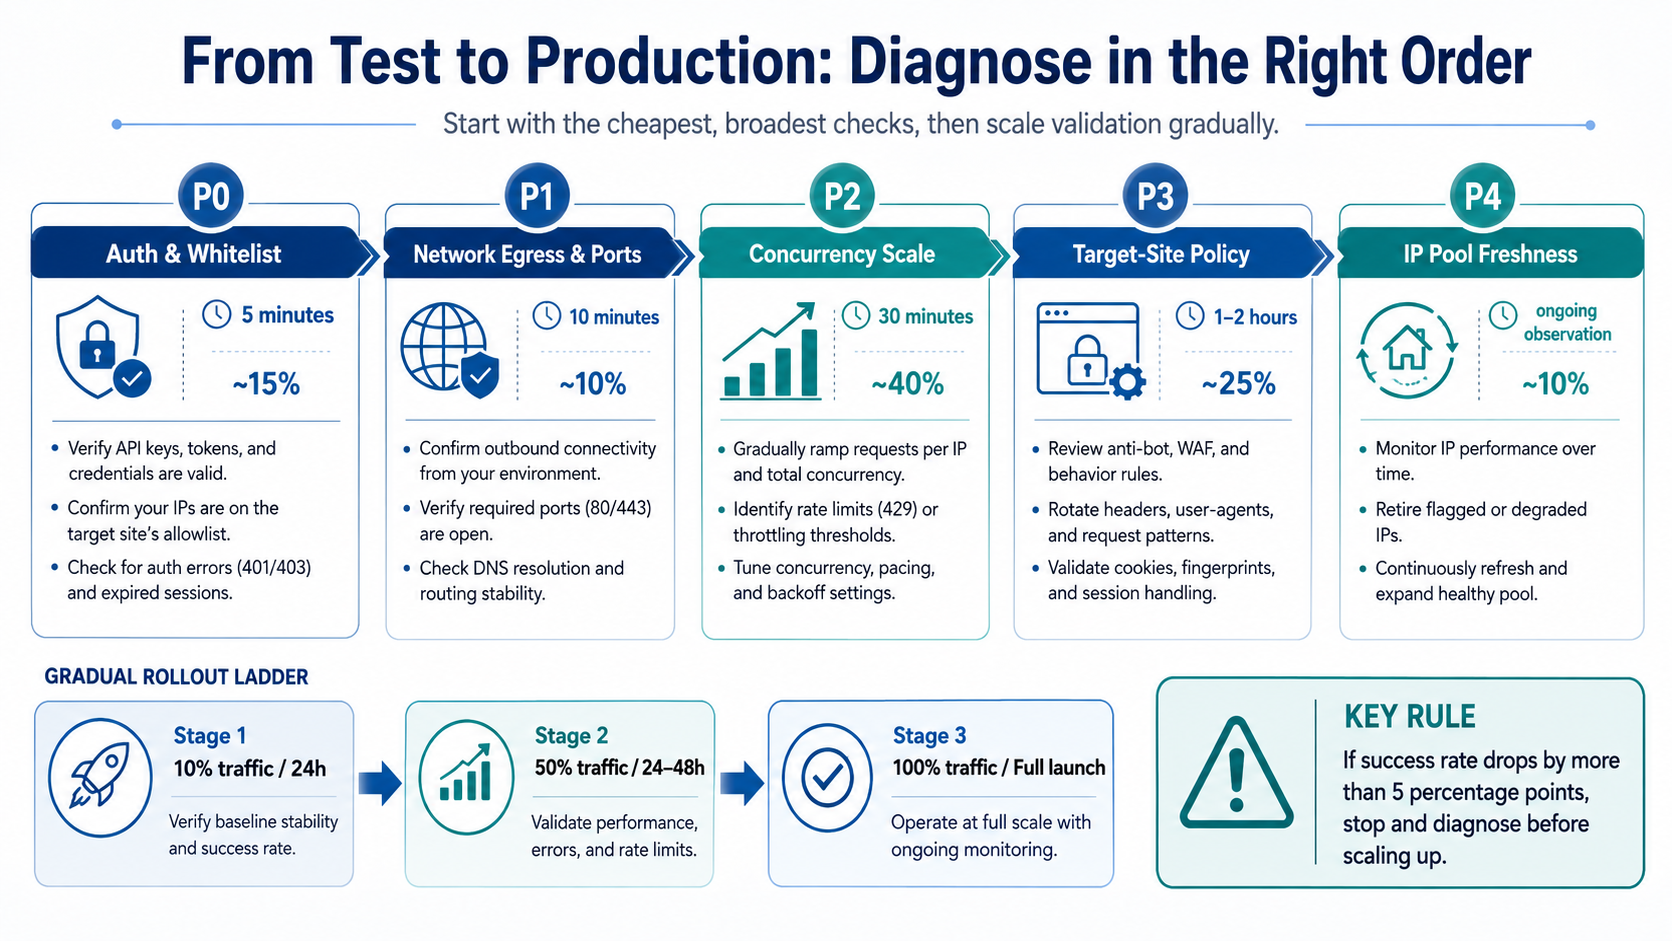
Order by the "lowest cost, broadest coverage" principle. Investigate the easiest-to-verify and most common causes first; dig into low-frequency but complex causes later.
Recommended diagnostic order:
| Priority | Diagnostic Layer | Time | Share of Failures Covered |
|---|---|---|---|
| P0 | Auth and whitelist | 5 minutes | ~15% |
| P1 | Network egress and ports | 10 minutes | ~10% |
| P2 | Concurrency scale | 30 minutes | ~40% |
| P3 | Target site policy changes | 1-2 hours | ~25% |
| P4 | IP pool freshness decay | Ongoing observation | ~10% |
P0 and P1 are "5-minute exclusion" checks — extremely low cost but covering 25% of failures. If both pass, move into P2's gradual rollout testing. P3 and P4 typically require longer observation periods and more data accumulation.
Production debugging of proxy IPs is essentially "variable control" — change one condition at a time, watch the success rate response, and isolate the differing layer. Rushing to a full-volume launch all at once stacks multiple variables and makes it impossible to identify the actual failure source.
FAQ
Q: We're using the same batch of IPs in test and production — why still fail?
The same batch of IPs behaves completely differently under different concurrency pressure. In testing, single-threaded low-frequency access keeps detection risk extremely low. In production, using the same batch of IPs at high concurrency produces an abnormal request density on the target site, triggering rate limiting. The IPs themselves are fine — the usage pattern changed.
Q: Success rate drops daily after launch — is IP quality deteriorating?
Most likely it's IP freshness decay. Once a residential IP is flagged by the target site, it doesn't recover quickly. Monitor the daily success rate curve and proactively request IP rotation or switch IP ranges when success rate falls below threshold. Also check whether you're sharing an IP pool with other workloads.
Q: Manual curl testing works fine, but the program fails — what gives?
Three common causes: the program's request headers are incomplete, causing the target site to identify it as bot traffic; the program's concurrency exceeds the proxy service's connection cap; the program's timeout is set too short and the high latency of residential IPs gets misjudged as failure. Check request headers, concurrency, and timeout configuration one by one.
Q: After containerized deployment, all proxy connections time out — what to do?
Check container network configuration first. Docker's default bridge network is usually fine, but overlay networks or custom networks may restrict proxy protocols. Confirm that the container can telnet to the proxy gateway port, check that the host's iptables rules allow proxy traffic, and verify that the container's DNS config can resolve the proxy gateway domain.
Q: How do I tell proxy-layer failure from target-site limiting?
Look at the HTTP status code and response body. Proxy-layer failures usually return 407, 502, 503, or connection timeout. Target-site limiting typically returns 200 with a captcha page as content, or returns 403 or 429. Capture the full response headers and the first 100 bytes of the response body and you can distinguish quickly.
Q: How do I do gradual rollout testing exactly?
Three stages. Stage 1: run with 10% of production traffic for 24 hours, recording success rate and error distribution. Stage 2: ramp to 50%, run for 24-48 hours, watching whether success rate stays stable. Stage 3: full launch. Between stages, compare core metrics. If success rate drops by more than 5 percentage points, stop and diagnose — don't keep increasing volume.
Q: Residential IPs have much higher latency than datacenter IPs — is that normal?
Yes. Residential IPs route through real home network egresses — 2-3 hops more than datacenter IPs — with average latency between 200-800ms versus 50-200ms for datacenter IPs. Program timeout settings need to fit this latency band. We recommend setting per-request timeout to 10-15 seconds to avoid misjudging normal high latency as failure.
Switching proxy IPs from test to production isn't about "whether the IPs are good enough" — it's about "whether the environment variables line up." Level out the 5 layers of differences one by one, and production success rate will naturally converge near the test level. Rushing to blame "bad IP quality" and frequently swapping providers will only make debugging costs snowball.



