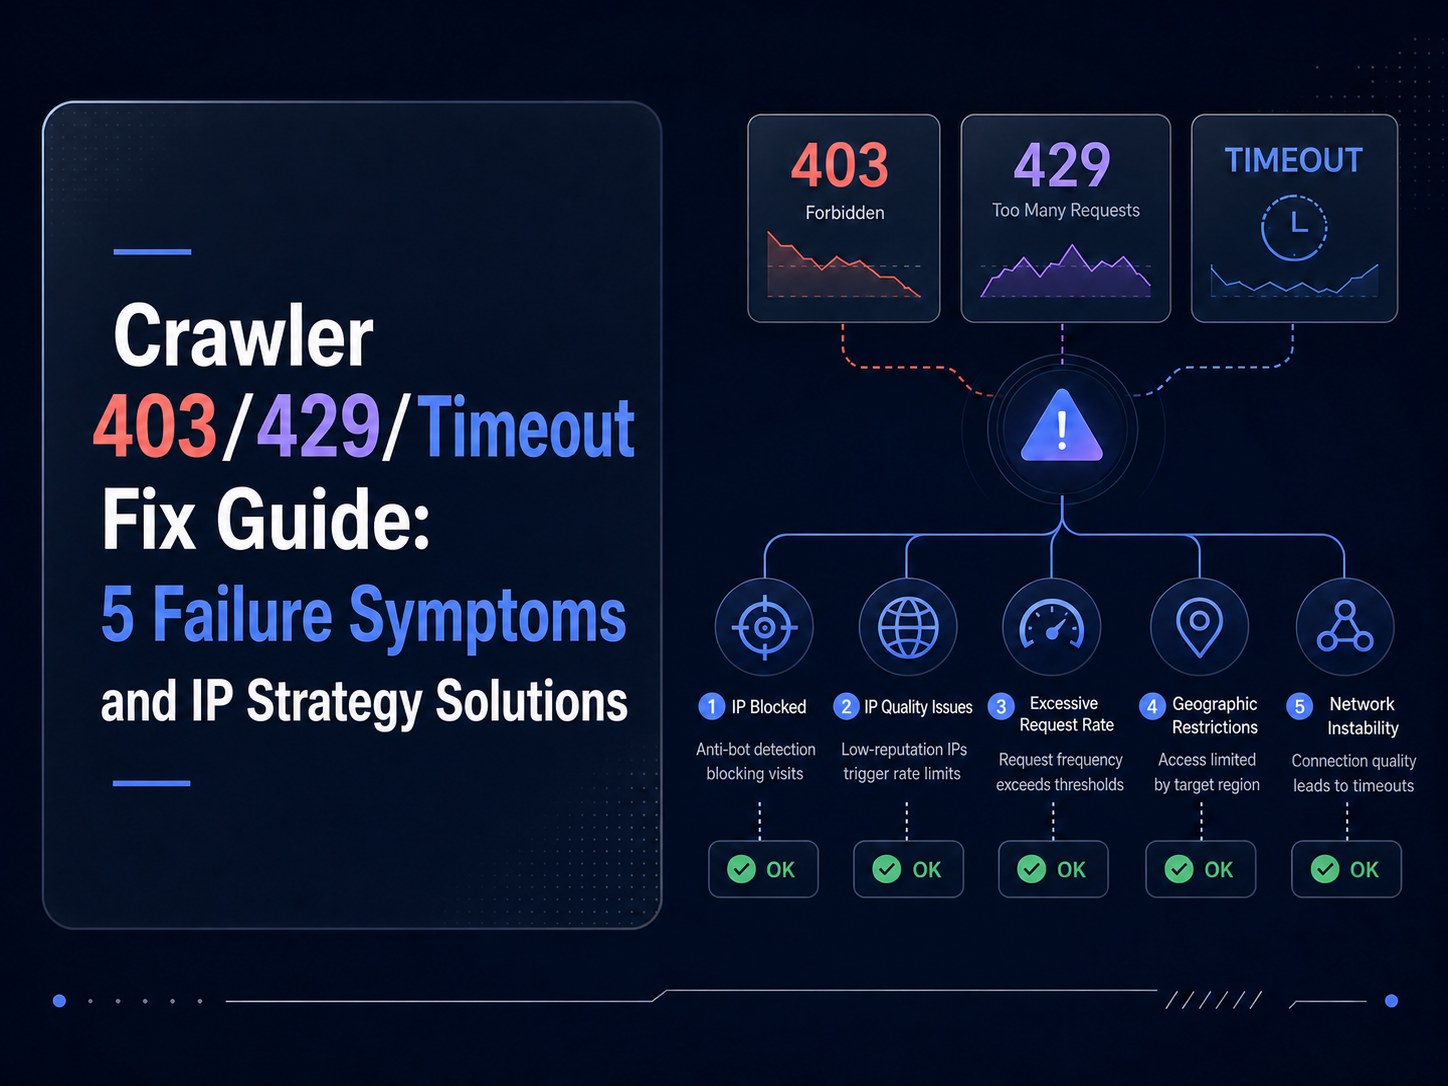
When You Hit a Connection Failure or Timeout, What Do You Check First?
The first step isn't swapping proxies — it's looking at the combination of error code and response duration. These two signals can narrow the diagnosis down to 1–2 layers, making follow-up troubleshooting 10× more efficient.
The golden three-step diagnostic:
- Grab the error code: Is the client reporting
ECONNREFUSED,ETIMEDOUT,ECONNRESET, or an HTTP-layer4xx/5xx? That determines which layer to start from. - Look at the timing distribution: Is it "instant fail" (~tens of ms), "hung until timeout" (seconds to tens of seconds), or "slow response" (succeeds within tens of seconds but slowly)? Timing characteristics point directly to a specific layer.
- Look at the scope: Are all requests failing, only some IPs, only some target sites, or only certain time windows? Scope determines whether the fault is in a shared layer or a branch layer.
Without these three pieces of information, you're basically guessing. With them, most problems can be located within 10 minutes.
How Do You Quickly Locate the 8 Exception Categories?
Arranged from lower to upper layers. The combination of frequency and "error code / timing characteristic" lets you quickly locate which category you're dealing with.
| # | Exception Type | Common Error Code / Manifestation | Timing Characteristic | Diagnostic Layer |
|---|---|---|---|---|
| 1 | DNS resolution failure | ENOTFOUND, EAI_AGAIN | Instant fail or timeout | Pre-application layer |
| 2 | TCP connect timeout | ETIMEDOUT, ECONNREFUSED | 5–30s hang | Transport layer |
| 3 | TLS handshake anomaly | certificate verify failed, SSL_ERROR_* | 1–10s fail | Session layer |
| 4 | HTTP 4xx/5xx | 403, 429, 502, 503 | Quick return | Application layer |
| 5 | Proxy auth failure | 407, "proxy authentication required" | Quick return | Proxy layer |
| 6 | Target site rate-limit / challenge | 429, or 200 with challenge page body | Normal speed | Target policy layer |
| 7 | Local bandwidth / concurrency bottleneck | Bulk tasks all slow together | Overall degradation | Client environment |
| 8 | Improper client timeout config | Frequently trips ReadTimeout | Fails right at the timeout threshold | Client config |
Exception 1: Domain Won't Resolve — DNS Resolution Failure
Symptom: Client reports ENOTFOUND, EAI_AGAIN, or Name or service not known; the request dies before hitting the TCP layer.
Quick locate: On the client machine, manually run dig <target domain> or nslookup <target domain> and see whether it resolves to an IP.
Three typical scenarios:
- Local DNS unconfigured or misconfigured: Switch to a public DNS like
8.8.8.8or1.1.1.1and retry. If it resolves after switching, the local DNS service is the problem. - Target domain resolves to an internal IP or has been taken down: Test with a different DNS provider, or have a machine in a different region resolve the same domain for comparison.
- When DNS goes through the proxy, proxy-side DNS is misconfigured: Check the
--resolveor DNS-over-HTTPS options in the proxy config. When using a SOCKS5 proxy, confirm remote DNS is enabled — i.e., use thesocks5h://prefix rather thansocks5://, otherwise DNS resolution happens locally and the proxy only forwards TCP.
Remediation:
- Short-term: switch to public DNS, or hardcode the target IP in the client to bypass DNS.
- Long-term: unify DNS policy across the scraping cluster; recommend DNS-over-HTTPS with a fallback resolver configured.
Exception 2: Three-Way Handshake Fails — TCP Connect Timeout
Symptom: Error code ETIMEDOUT or ECONNREFUSED; timing usually hangs at the system default TCP connect timeout (~30s on Linux).
Quick locate: On the client machine, manually run telnet <IP> <port> or nc -zv <IP> <port> to see whether a connection can be established.
Three typical scenarios:
- No service listening on the target port:
ECONNREFUSED, returns immediately. Machine is alive but the port isn't open — contact the service provider to confirm. - Intermediate network unreachable / blocked by firewall:
ETIMEDOUT, prolonged unresponsiveness. Usetracerouteto see which hop disappears, and determine whether it's local egress, an intermediate ISP, or the target's data center. - Proxy node is offline: Occurs only when requesting through the proxy — direct-to-target works. The proxy node itself is faulty; tasks should switch to a different node.
Remediation:
- Immediate: eject the failing node from the pool and reschedule tasks to a backup node.
- Short-term: lower the client TCP connect timeout to 3–8 seconds to avoid hanging on dead connections.
- Long-term: add health-check probes to the proxy node pool and proactively retire unreachable nodes.
Exception 3: Certificate or Protocol Mismatch — TLS Handshake Anomaly
Symptom: Error codes SSL_ERROR_*, certificate verify failed, unable to get local issuer certificate, handshake failure.
Quick locate: Use openssl s_client -connect <target domain>:443 -showcerts to manually verify the TLS handshake and check the specific reason in the error message.
Four typical scenarios:
- Incomplete client certificate chain: The client environment lacks the CA root certificate, or the system certificate store has expired. Updating the certificate store (i.e., the
ca-certificatespackage) usually fixes it. - Target site certificate expired or domain mismatch: This is a target-site operations problem, not something the scraper can fix — contact the target site or skip it.
- TLS version mismatch: The target site enforces TLS 1.2+, but the client only supports TLS 1.0/1.1. Upgrade the client or HTTP library.
- TLS fingerprint identified and rejected by the target site: Handshake succeeds but the target returns 403 or drops the connection. You need to switch to an HTTP client that can spoof mainstream browser TLS fingerprints.
Remediation:
- Maintain a unified CA certificate store version across client environments.
- Prefer HTTP clients that support TLS 1.3 and mainstream browser fingerprints.
- Never use
verify=Falsein production — you're just handing the data-integrity risk back to yourself.
Exception 4: Target Site Rejects Directly — HTTP 4xx/5xx
Symptom: TCP and TLS both succeed; the HTTP response code is 4xx or 5xx.
Handling by category:
| Status Code | Meaning | Common Cause | Handling Strategy |
|---|---|---|---|
| 400 | Bad request format | Header/body construction error | Inspect request-construction code, compare to browser packet capture |
| 401 | Not authenticated | Missing Cookie/Token | Check session-persistence logic |
| 403 | Access denied | IP restricted, UA identified, Referer abnormal | Rotate IP, clean session, fix Header |
| 404 | Resource not found | Wrong URL, page taken down | Verify URL, update target list |
| 429 | Requests too fast | Triggered target frequency control | Slow down, back off, rotate IP |
| 500 | Server-side error | Target site's own problem | Wait and retry — no need to rotate IP |
| 502/503/504 | Gateway error | Target site or CDN temporary issue | Short backoff then retry; alert if persistent |
Special note: When mass 403s appear, don't blindly rotate proxies. First check whether all IPs return 403 or only some. If all IPs — likely a header/UA/request-path problem. If only some — then it's an IP pool quality issue.
Exception 5: Proxy Auth Failure or Whitelist Not Working
Symptom: HTTP 407 or plaintext "proxy authentication required" / "authentication failed" from the proxy.
Three typical scenarios:
- Wrong or expired credentials: Check the proxy product config and re-fetch credentials.
- The whitelist-bound client IP changed: Check whether the client's egress IP has changed — moved data center, switched ISP, office network NAT egress changed. Whitelist-mode proxies demand high egress-IP stability.
- Auth mode doesn't match the proxy product: e.g., using
Basicauth when the proxy requiresDigest, or passing credentials via URL when the proxy only accepts headers.
Remediation:
- At deployment, register the current client egress IP into the whitelist — don't use variable addresses like "office network egress."
- Route the distributed scraping cluster through a single batch of egress IPs to reduce whitelist maintenance cost.
- Credential-based auth suits elastic-scaling scenarios better than whitelist auth.
Exception 6: Target Site Rate-Limit or Risk-Control Challenge
Symptom: HTTP 429, or HTTP 200 but the body is a verification challenge page — CAPTCHA, "abnormal access detected" notice, blank page.
Signal to distinguish: Response body byte count is significantly smaller than a normal page — e.g., a detail page that normally averages 200KB suddenly returns just 2KB — or the body contains challenge keywords like captcha, challenge, verify.
Remediation:
- Immediately cool down IPs that triggered the limit (recommended cooldown starts at 30 minutes; adjust based on target strictness).
- Reschedule current tasks to IPs outside the cooldown pool.
- Check whether request cadence is too fast — lower per-IP QPS as needed.
- Check header authenticity, especially whether
Accept-LanguageandSec-Fetch-*match real browsers. - Don't hard-retry on the same IP — that just accelerates IP burnout.
Exception 7: Local Bandwidth or Concurrency Bottleneck
Symptom: All requests slow down overall, failure rate rises, but error codes are scattered and no single target site shows concentrated problems.
Quick locate:
- Check CPU, memory, and network bandwidth utilization on the client machine (
top,iftop,nload). - Check the client process's file descriptor count (
lsof -p <PID> | wc -l); approaching the system limit producestoo many open files. - Check the size of the client's HTTP connection pool — e.g.,
aiohttp'sconnector.limit;requests'ssessiondefaults to only 10 connections. - Check whether other tasks are competing for bandwidth.
Remediation:
- Scale up the client machine, or scale out across multiple machines.
- Raise the HTTP connection pool cap.
- Raise
ulimit -n. - Deploy the scraping cluster in isolation from other network-heavy workloads.
Exception 8: Improper Client Timeout Config
Symptom: A large number of requests all hang at exactly the same timeout threshold — "10.02 seconds," "30.05 seconds," suspiciously close to integer values — then fail, rather than distributing randomly.
Root cause: The three parameters of client timeout config aren't being distinguished:
- Connect timeout: Max wait for TCP handshake. Recommended 3–8 seconds.
- Read timeout: Max wait from request sent to first byte received. Set by target response characteristics — recommended 10–30 seconds.
- Total timeout: Max duration for the whole request, including connect + send + wait + receive. Set to 3–5× the target's average duration.
Setting all three to the same value is a common mistake. Reasonable config is "short connect timeout, medium read timeout, long total timeout."
Remediation:
- Configure the three-layer timeout based on target-site response duration distribution.
- Configure longer read timeouts separately for slow targets — don't use one value for everything.
- Combine with the HTTP client's retry policy so failed requests fail fast and retry fast, rather than hanging for a long time.
How Do You Build a Continuously Available Connection Health Probe?
Troubleshooting is reactive; probes are proactive. A continuously available connection health probe moves "fault discovery" from "user report" to "within minutes of the fault occurring."
Four-layer probe design:
| Probe Layer | Probe Frequency | Probe Content | Alert Threshold |
|---|---|---|---|
| DNS probe | Every minute | DNS resolution success rate for key target domains | 3 consecutive failures |
| TCP probe | Every minute | TCP reachability of the proxy node pool | Pool reachability <80% |
| HTTP probe | Every 5 minutes | HTTP response code distribution for key target URLs | 5xx ratio >5% or 429 ratio >2% |
| Business probe | Every 15 minutes | End-to-end scraping script execution, validating ingested data completeness | Data point loss >10% |
Key design points:
- Probes must use completely independent IP egress from production scraping, to avoid probes being collaterally hit by restrictions on the production IP batch.
- Probe target URLs must be representative targets, not edge cases.
- Alerts need tiering — e.g., critical / warning / info — to avoid alert fatigue.
- Alert content should include error code, duration, and failing IP samples, so it flows straight into the diagnostic workflow.
What Are Common Troubleshooting Mistakes?
| Mistake | Correct Approach |
|---|---|
| Swap proxies on every failure | Locate the specific layer via error code first, then decide the action |
| Hard-retry on the same IP | Cool down the IP immediately when it hits a limit; move tasks to other IPs |
verify=False to skip TLS verification | Update the certificate store or fix the TLS version — don't abandon verification |
| Set all timeouts to the same value | Split into connect/read/total three layers, configured by target characteristics |
| Only look at overall success rate | Slice success rate by target site, IP pool, and time window |
| No logs during troubleshooting | Record request ID, proxy node, duration, status code for every request — trace back after faults |
FAQ
Q: When troubleshooting a connection failure, should I suspect the client, the proxy, or the target site first?
Judge by fault scope, not by intuition. All clients + all proxies failing → likely a target site problem. All clients failing only against a specific proxy pool → proxy pool problem. Only some clients failing → client environment problem. Only against a specific target site → target-site policy or path-to-target problem for that client. Scope analysis saves 80% of troubleshooting time.
Q: If the proxy returns 200 but the content is a blank or anomalous page, does that count as success or failure?
Technically success (HTTP 200), business-wise a failure (no target data retrieved). Healthy scraping scripts should add a "business success check" layer after the HTTP response — e.g., check whether the HTML contains expected key DOM nodes; if not, go through the failure-retry logic. HTTP response code alone isn't enough.
Q: Intermittent timeouts — the hardest to troubleshoot because they come and go — is there a systematic method?
Intermittent timeouts usually have three causes: (1) the target site has time-window-based frequency control (e.g., per-minute threshold) — you need long-range request logs to spot the cadence; (2) some hop in the middle network is unstable — mtr run continuously for 10 minutes shows the packet-loss location; (3) the client machine has other loads competing for resources. Systematic method: monitor "three dimensions simultaneously" — time dimension via request distribution, path dimension via mtr, client dimension via machine metrics. Aligning the three locates 90% of intermittent issues.
Q: A proxy IP pool's availability suddenly drops from 95% to 70% — how do I investigate?
Four steps: (1) look at the timeline — cliff drop or gradual degradation? Cliff drops are usually external events (target policy change, provider node fault); gradual degradation is usually pool aging. (2) Look at failure distribution — all targets or concentrated on a few? Concentrated failure means a specific target's policy changed. (3) Look at failure type — TCP-layer or HTTP-layer? TCP-layer points to the proxy nodes; HTTP-layer points to target policy. (4) Contact the proxy provider to verify node status while switching to the backup pool as an emergency measure. Don't use the "restart everything" approach before the cause is clear — it can mask the real problem.